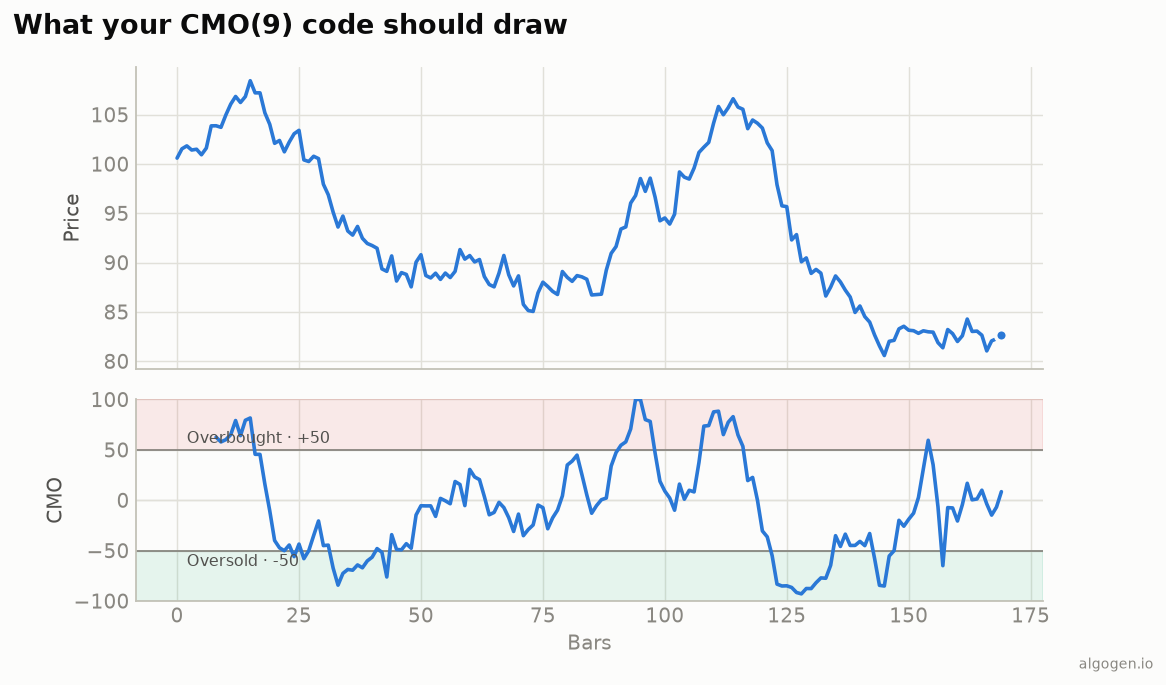
EasyLanguage ships a CMO reserved-word function, so the standard Chande Momentum
Oscillator is a one-liner — and the from-scratch version shows the summed up/down
machinery. See the explainer.
What you’ll need
- TradeStation or MultiCharts
- The EasyLanguage / PowerLanguage Editor, a new Indicator
The source (built-in)
{ AlgoGen Chande Momentum Oscillator — TradeStation / MultiCharts }
inputs:
    Price( Close ),
    Length( 9 );

variables:
    CMOVal( 0 );

CMOVal = CMO( Price, Length );

Plot1( CMOVal, "CMO" );
Plot2( 50, "OB" );
Plot3( -50, "OS" );
Plot4( 0, "Zero" );
CMO( Price, Length ) returns the Chande Momentum Oscillator on its ±100 scale; the
extra plots draw the +50/−50 zones and zero line from the output chart.
From scratch
To see what the reserved word does:
{ Manual CMO with Summation }
inputs: Price( Close ), Length( 9 );
variables: Chg( 0 ), UpMove( 0 ), DnMove( 0 ), SU( 0 ), SD( 0 ), CMOVal( 0 );

Chg = Price - Price[1];
UpMove = MaxList( Chg, 0 );
DnMove = MaxList( -Chg, 0 );

SU = Summation( UpMove, Length );
SD = Summation( DnMove, Length );

if SU + SD <> 0 then
    CMOVal = 100 * ( SU - SD ) / ( SU + SD )
else
    CMOVal = 0;

Plot1( CMOVal, "CMO" );
MaxList( Chg, 0 ) isolates up-moves, MaxList( -Chg, 0 ) the down-moves as positives;
Summation totals each over the window; then the ±100 formula. This reproduces the
built-in CMO.
Gotchas
Summation, not an average. No smoothing — plain sums. That’s what separates it from RSI.- Guard
SU + SD = 0. A flat window would divide by zero; return 0 instead. - ±50 zones. Wider than RSI’s ±70/30 because the CMO swings harder.
Length = 9is Chande’s default and is fast; 14 or 20 smooth it.
Same indicator elsewhere: Python, MQL5, Pine Script, NinjaScript. Then backtest it in AlgoGen.
This post is educational, not financial advice. Indicators describe the past; they don’t predict the future. Backtest anything before you risk real money on it.
Sources and further reading
- What is EasyLanguage? (TradeStation)