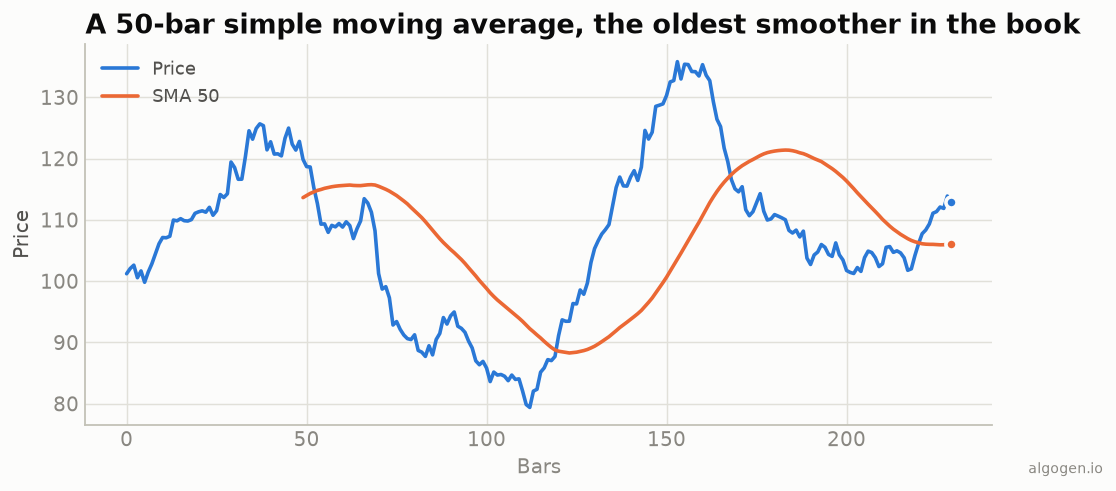
The Simple Moving Average is so ordinary that it barely feels like it should have a history. It’s just an average that slides along. But that very ordinariness is the story: the SMA is older than the trading industry that adopted it, older than the computers that made it trivial, and it arrived in finance secondhand from the world of economic statistics. Nobody “invented” it so much as a series of practical people kept reaching for the same obvious idea.
It started in statistics, not trading
The moving average was a tool of time-series statistics decades before technical analysts got hold of it. Around 1901, the British economist and statistician R. H. Hooker computed rolling averages of economic data to smooth out short-term fluctuations and expose the underlying trend — exactly the job the SMA still does on a price chart. A few years later the statistician G. Udny Yule described Hooker’s rolling figures as “moving-averages,” and the name stuck. Yule went on to do foundational work on autoregressive and moving-average processes in the 1920s that still underpins modern time-series analysis.
So when you drop a 20-bar SMA on a chart, you’re using a technique that was first aimed at things like trade cycles and marriage rates. The math doesn’t care what the numbers represent.
It arrives on Wall Street
Averaging prices to see a trend is an idea old enough that pieces of it show up in Charles Dow’s writings around the turn of the century, though Dow worked more with the idea of trends than with formal moving averages. The clearer milestone comes in 1935, when H. M. Gartley published Profits in the Stock Market, a landmark book that laid out — among many other things — the idea of trading with moving averages. It’s one of the earliest widely-read treatments of the technique aimed squarely at market practitioners.
Donchian and the birth of trend following
The person who really turned the moving average into a system was Richard Donchian, widely called the father of trend following. Starting in the 1930s and refining it through the 1950s, Donchian championed mechanical rules built on moving averages — most famously a 5-day and 20-day moving average crossover: go long when the fast average crosses above the slow, go short when it crosses below. This was radical. In an era of tips, hunches, and hand-drawn lines, Donchian was proposing that you could define your buy and sell decisions with arithmetic and follow them without argument.
That idea — a rule you can write down, compute, and test — is the direct ancestor of every systematic and algorithmic strategy running today. It’s also, not coincidentally, deeply Mustachian: no gurus, no crystal balls, just a repeatable process you can verify.
The building block of everything else
Here’s what makes the SMA’s history matter even if you never trade a crossover: it’s the foundation half the indicator list is built on. Bollinger Bands are a moving average with volatility bands bolted on. The MACD is the difference between two moving averages. Countless “oscillators” are really just price compared to its own average. When you understand the humble SMA, you’ve already understood the skeleton of dozens of fancier-sounding tools that get repackaged as something new. Donchian’s descendants took this idea and ran: the legendary Turtle Traders of the 1980s, trained by Richard Dennis and William Eckhardt, ran mechanical breakout-and-trend systems that are direct cultural heirs of Donchian’s moving-average discipline — proof that a boring average, followed with iron consistency, could build fortunes.
Why it exploded
Two forces made the SMA ubiquitous. First, it’s cheap to compute — you could do a short moving average by hand on graph paper, and traders did, for decades. Second, when charting software and personal computers arrived, an indicator that was nothing but “sum and divide” was the easiest thing in the world to program. It was already familiar, already trusted, and now instant. It became a default study on every platform and never left.
The one number everyone quotes
Somewhere along the way the 200-day moving average became a cultural touchstone. Financial news anchors who couldn’t define the RSI will still solemnly announce that an index has “fallen below its 200-day moving average,” as if a spell has been broken. Part of that power is genuine — long averages do a decent job of separating broad up-phases from down-phases — and part of it is pure self-fulfilling prophecy, because so many people act on the same line.
That’s the quiet lesson of the SMA’s history. It didn’t win because it was sophisticated. It won because it was simple, old, and free — reinvented by statisticians, adopted by traders, and never improved upon in its basic form, only weighted differently (see the EMA). You can build the exact same tool Donchian used, in an afternoon, in any language — as we do in the implementation posts.
This post is educational, not financial advice. Indicators describe the past; they don’t predict the future. Backtest anything before you risk real money on it.
Sources and further reading
- Gartley and the early use of moving averages (CMT Association)