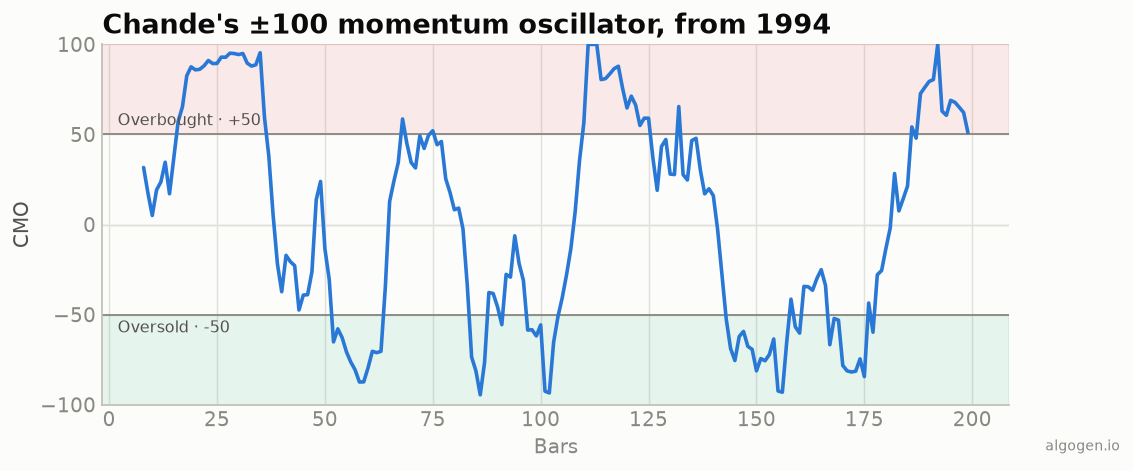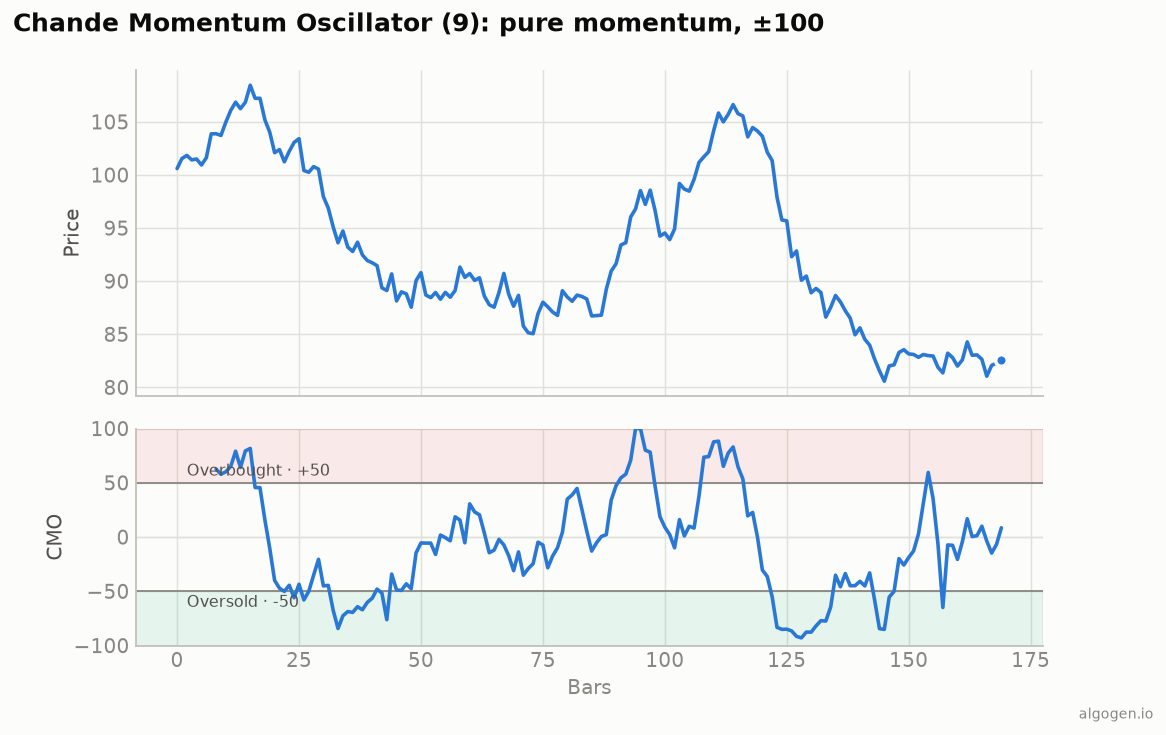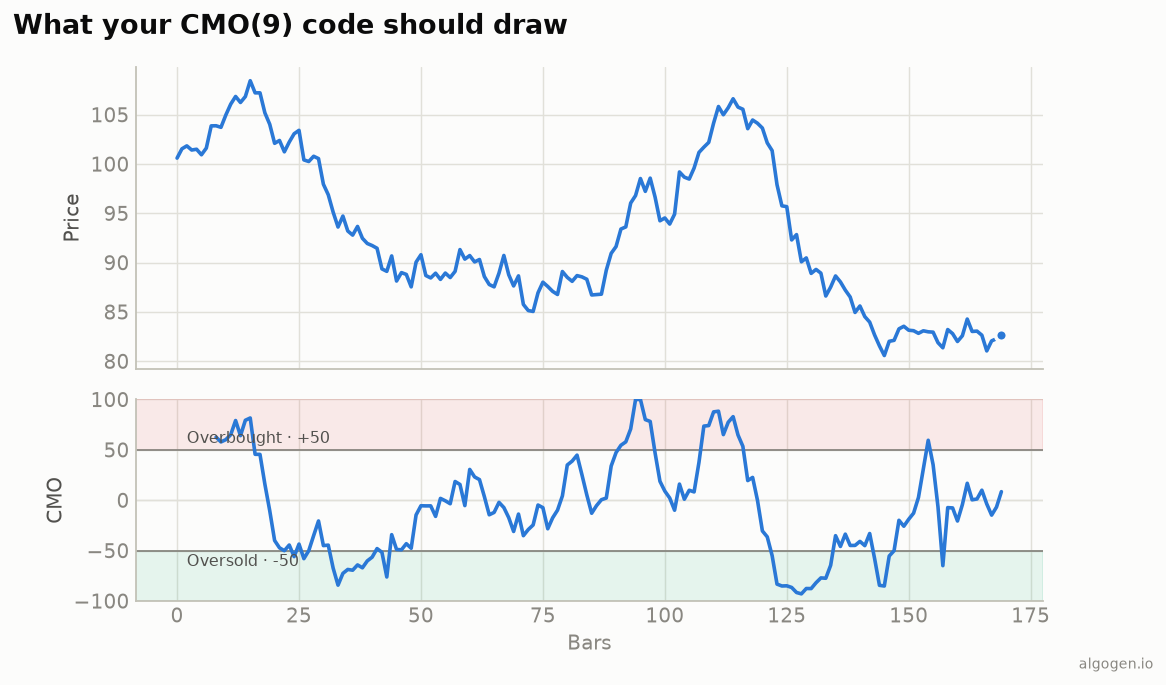
MetaTrader 5 doesn’t ship the Chande Momentum Oscillator as a standard indicator, so this one you build yourself — which is easy, because it’s just two summed loops and a division. See the explainer.
What you’ll need
- MetaTrader 5 and the MetaEditor
- A new Custom Indicator, plotted in a separate window with ±100 levels.
The source
#property indicator_separate_window
#property indicator_minimum -100
#property indicator_maximum  100
#property indicator_buffers 1
#property indicator_plots   1
#property indicator_label1  "CMO"
#property indicator_type1   DRAW_LINE
#property indicator_color1  clrDodgerBlue
#property indicator_width1  2
#property indicator_level1  50
#property indicator_level2 -50
#property indicator_level3  0

input int InpPeriod = 9;   // period

double CmoBuffer[];

int OnInit()
{
    SetIndexBuffer(0, CmoBuffer, INDICATOR_DATA);
    return(INIT_SUCCEEDED);
}

int OnCalculate(const int rates_total,
                const int prev_calculated,
                const int begin,
                const double &price[])
{
    if(rates_total <= InpPeriod) return(0);

    int start = (prev_calculated > InpPeriod) ? prev_calculated - 1 : InpPeriod;

    for(int i = start; i < rates_total; i++)
    {
        double su = 0.0, sd = 0.0;
        for(int k = 0; k < InpPeriod; k++)
        {
            double diff = price[i - k] - price[i - k - 1];
            if(diff > 0) su += diff;
            else         sd += -diff;
        }
        double denom = su + sd;
        CmoBuffer[i] = (denom == 0.0) ? 0.0 : 100.0 * (su - sd) / denom;
    }
    return(rates_total);
}
The inner loop walks the last InpPeriod bars, accumulating up-moves into su and
down-moves (as positives) into sd. Then 100 * (su - sd) / (su + sd) is the CMO — the
±100 line from the output chart, with the +50/−50 levels drawn by indicator_level.
Gotchas
- No smoothing. Just raw sums over the window. If you add an EMA to
su/sd, you’ve built something closer to RSI. - Guard the zero denominator. A flat window gives
su + sd == 0; return 0 (or skip) rather than dividing. price[i-k-1]needs one extra bar. The loop reads one bar before the window, so start atInpPeriod, notInpPeriod - 1.- Fix the scale.
indicator_minimum/maximumat ±100 keeps the pane stable and the ±50 levels meaningful.
Same indicator elsewhere: Python, Pine Script, EasyLanguage, NinjaScript. Then test it in AlgoGen.
This post is educational, not financial advice. Indicators describe the past; they don’t predict the future. Backtest anything before you risk real money on it.
Sources and further reading
- Technical indicator functions (MetaQuotes)