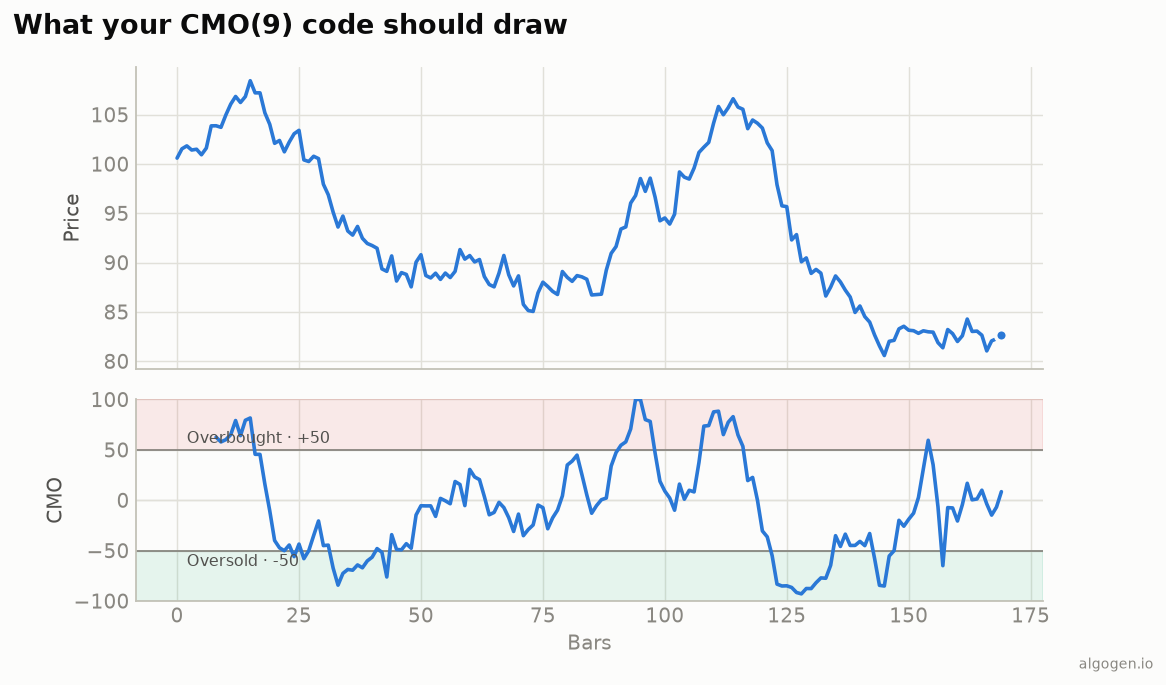
Pine has ta.cmo built in, so the canonical Chande Momentum Oscillator is one line — and
the from-scratch version shows the summed-momentum machinery. See
the explainer.
What you’ll need
- A TradingView account (free tier is fine)
- The Pine Editor
The source
//@version=5
indicator("AlgoGen Chande Momentum Oscillator", shorttitle="AG CMO", overlay=false)

length = input.int(9, "Length")
cmoVal = ta.cmo(close, length)

plot(cmoVal, "CMO", color=#2a78d6, linewidth=2)
h50  = hline(50,  "Overbought", color=color.gray)
hm50 = hline(-50, "Oversold",   color=color.gray)
hline(0, "Zero", color=color.new(color.gray, 60))
fill(h50, hline(100),  color=color.new(#e34948, 90))
fill(hline(-100), hm50, color=color.new(#1baf7a, 90))
ta.cmo(close, length) returns the Chande Momentum Oscillator on its ±100 scale, and the
hlines mark the +50/−50 zones and the zero line from the output chart.
From scratch
To see exactly what ta.cmo computes:
//@version=5
indicator("AlgoGen CMO (manual)", overlay=false)
length = input.int(9, "Length")
change1 = close - close[1]
up = math.max(change1, 0)
down = math.max(-change1, 0)
su = math.sum(up, length)
sd = math.sum(down, length)
cmoManual = 100 * (su - sd) / (su + sd)
plot(cmoManual, color=#2a78d6, linewidth=2)
math.max(change1, 0) and math.max(-change1, 0) split each bar’s change into up and
down parts; math.sum totals each over the window; then (su - sd) / (su + sd). This
reproduces ta.cmo.
Note: no smoothing
Notice there’s no ta.rma or ta.ema anywhere — that’s deliberate. RSI (ta.rsi) runs
its up/down averages through Wilder smoothing (ta.rma); the CMO uses plain math.sum.
That single difference is the whole reason to reach for the CMO instead of RSI.
A signal to test
cmoVal = ta.cmo(close, 9)
bull = ta.crossover(cmoVal, 0)          // momentum flips positive
bear = ta.crossunder(cmoVal, 0)
plotshape(bull, "CMO up", shape.triangleup, location.bottom, color=#0ca30c, size=size.tiny)
plotshape(bear, "CMO down", shape.triangledown, location.top, color=#d03b3b, size=size.tiny)
alertcondition(bull or bear, "CMO zero cross", "CMO crossed zero")
The zero-cross is the CMO’s cleanest directional cue — a good thing to backtest in AlgoGen.
Gotchas
- No smoothing.
math.sum, notta.rma; smoothing would make it RSI. - ±50 zones. The CMO’s wider thresholds suit its faster swings; ±70/30 (RSI’s) are too tight here.
overlay=false. It’s a bounded oscillator — plot it in its own pane.
Same indicator elsewhere: Python, MQL5, EasyLanguage, NinjaScript.
This post is educational, not financial advice. Indicators describe the past; they don’t predict the future. Backtest anything before you risk real money on it.
Sources and further reading
- Pine Script built-ins (TradingView)