The Stochastic Oscillator has one of the more tangled origin stories in technical analysis — part 1950s Chicago trading floor, part decades-long attribution dispute, and part one charismatic teacher who put his name on it so thoroughly that most people assume he invented it single-handedly. The truth is messier and, honestly, more interesting.
The name most people know
George Lane (1921–2004) is the name attached to the stochastic. He began a five-decade career in the markets with the brokerage E. F. Hutton in the 1950s, and became President of Investment Educators Inc. in Watseka, Illinois, where he taught technical analysis to generations of traders. Lane was a gifted communicator and tireless promoter, and it’s largely through his teaching, seminars, and writing that “Lane’s Stochastics” became a household name among technicians. He was especially known for hammering home the importance of divergence — which he considered the indicator’s most valuable signal.
The part Lane didn’t do alone
Here’s the wrinkle the popular story usually skips: Lane did not invent the stochastic by himself. He joined Investment Educators around 1954 and worked alongside a group of futures traders who were experimenting with momentum oscillators while trading commodities at the Chicago Board of Trade. A central figure in that group was C. Ralph Dystant (1902–1978), and the question of who truly originated the %K/%D oscillator — Dystant, Lane, or the group collectively — has been debated by historians of technical analysis for years. The fair summary: Lane can’t be credited as the sole inventor, but he absolutely earned recognition for a lifetime of developing and popularizing it.
Why “%K” and “%D”?
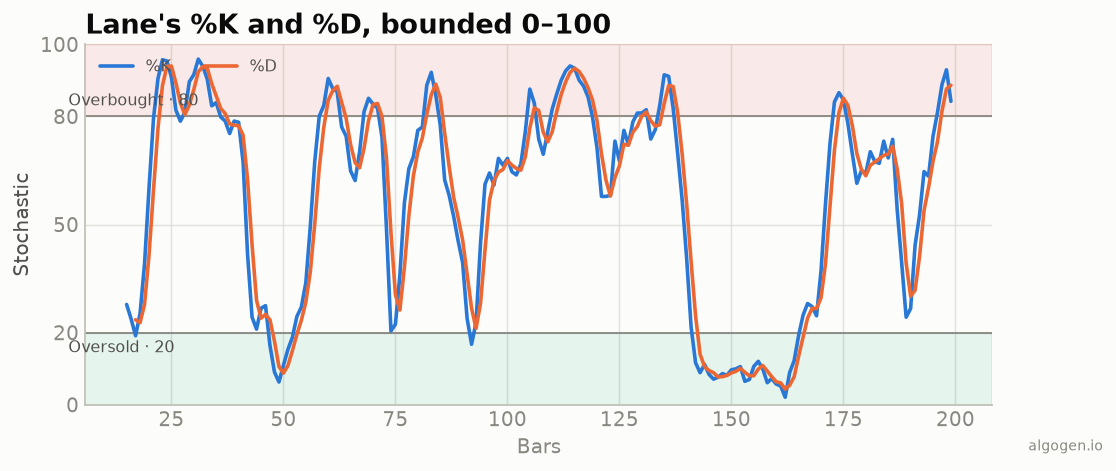
The odd letter names are a fossil of the research process. The group was experimenting with a whole series of oscillators, and they hit a practical problem: their raw indicators were “running all over the page” at wildly different scales, impossible to compare. Their fix was to express each one as a percentage of 100 — bounding it to a readable 0–100 range. They worked through a lettered sequence of attempts — %A, %B, and onward — testing dozens of formulations. The two that survived and proved useful were the ones we still use: %K (the raw line) and %D (its smoothed signal). The letters are just where those particular experiments landed in the alphabet. There was never a grand theory behind K and D; they’re lab labels that stuck.
About that intimidating name
“Stochastic” sounds like it should involve heavy probability theory. It doesn’t. The everyday meaning of stochastic relates to randomness, but the oscillator itself is a plain, deterministic calculation — the position of the close within a recent range. Lane in later years was clear that the tool measures momentum and the closing position, not anything genuinely stochastic in the mathematical sense. Like a lot of great trading tools, it wears a fancier name than its arithmetic deserves — which, if you’ve read the rest of this series, is becoming a theme.
A family resemblance
If the stochastic’s “where’s the close in the range” logic sounds familiar, it should: it’s a close cousin of Williams %R, created by Larry Williams, which measures almost the same thing on an inverted scale. That’s not plagiarism — it’s convergent evolution. Several traders in the same era were circling the same intuition (closing position within a range predicts momentum) and arrived at nearly identical arithmetic dressed up differently. It’s a good reminder that most indicators are variations on a small number of honest ideas, not dozens of unrelated inventions.
Why it endured
The stochastic had everything going for it as it spread: a bounded, easy-to-read 0–100 scale; multiple signal types (levels, %K/%D crosses, divergence); and a relentless evangelist in George Lane, who taught it for decades. When charting software arrived, the formula was trivial to compute and instantly familiar, so it became a default oscillator on every platform, usually sitting right next to the RSI.
And the Mustachian moral repeats: an indicator with a PhD-sounding name and a tangle of lore around it is, at bottom, “where did the close land in the recent range?” — a couple of lines of arithmetic you can build yourself, which is exactly what we do in the implementation posts.
This post is educational, not financial advice. Indicators describe the past; they don’t predict the future. Backtest anything before you risk real money on it.
Sources and further reading
- The Origins of the Stochastic Oscillator (CMT Association)