Heikin-Ashi has one of the more unusual histories in technical analysis: an old Japanese charting idea that sat almost unknown in the West until a single magazine article in 2004 pulled it into the mainstream. It’s worth separating the legend from the documented facts, because both get repeated as if equally certain.
The name and the idea
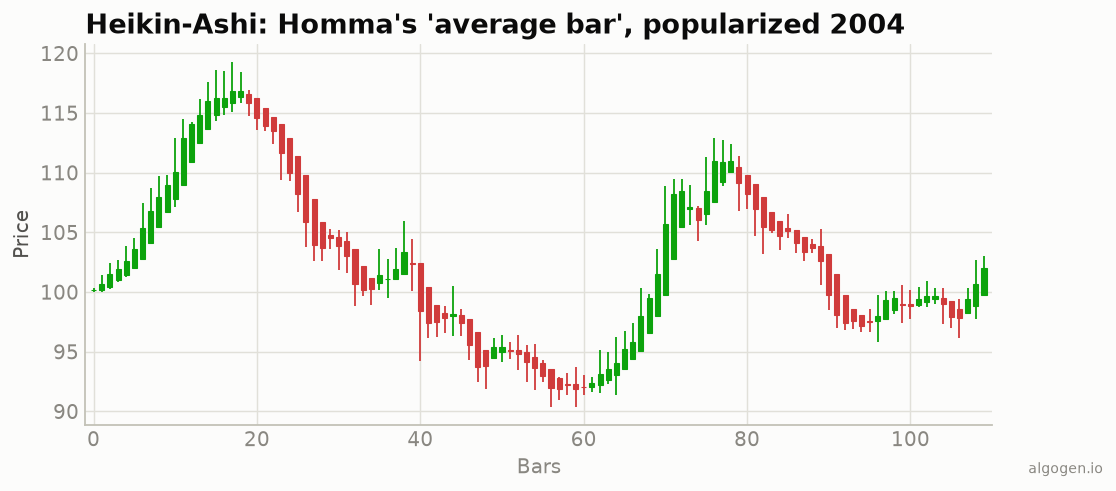
“Heikin-Ashi” is Japanese, and it translates roughly as “average bar” (heikin = average, ashi = bar or pace). That name is the whole thesis: instead of plotting the raw open, high, low, and close of each period, you plot averaged values that carry information forward from the previous bar. The result is a candlestick chart that smooths out noise and makes the underlying trend visually obvious.
The Japanese roots
Candlestick charting itself comes from 18th-century Japan and the Sakata rice markets. The rice merchant Munehisa Homma (also transliterated Honma), active in the 1700s, is widely regarded as the father of candlestick charting and one of the earliest technical analysts — a trader who wrote about market psychology and price behaviour centuries before the field had a name in the West.
Heikin-Ashi is frequently attributed to Homma or to the same Japanese tradition that produced candlesticks. It’s worth being honest here: the precise origin of the Heikin-Ashi technique is not well documented, and the Homma attribution is more a statement of lineage — it grew out of the same Japanese candlestick tradition — than a verified “Homma invented this specific method” claim. The technique is old and Japanese; the exact inventor and date are not cleanly recorded.
Dan Valcu brings it West (2004)
What is well documented is how Heikin-Ashi reached Western traders. The Romanian analyst Dan Valcu began researching the technique in 2003 and published the article that introduced it to the English-speaking world: “Using The Heikin-Ashi Technique,” in the February 2004 issue of Technical Analysis of Stocks & Commodities magazine.
Valcu was the first author to bring Heikin-Ashi from Japan and promote it in the West both as a visual charting method and as the basis for technical indicators. He later expanded the work into a book and further articles. It’s largely thanks to that 2004 article that Heikin-Ashi is now a built-in feature on virtually every modern charting platform — TradingView, MetaTrader, NinjaTrader, TradeStation and the rest all ship it out of the box.
Why it caught on
The timing helped. By 2004, retail charting software was becoming powerful and widespread, and traders were hungry for tools that cut through the noise of intraday price action. Heikin-Ashi delivered exactly that: a one-click reframing of an ordinary candlestick chart that made trends jump out and chop recede. It asked nothing of the user — no parameters to tune, no settings to argue about — and it worked on any timeframe and any instrument. That simplicity is a big part of why it spread so fast from one magazine article to a universal charting default.
The honest footnote
As with a lot of technical analysis, the folklore around Heikin-Ashi is thicker than the documentation. You’ll see confident claims that Homma personally devised it in the 1700s; treat those as tradition rather than citation. What we can say with confidence: the idea is old and Japanese, the name means “average bar,” and its journey into modern trading runs squarely through Dan Valcu’s 2004 work. The math, at least, is unambiguous — and you can reproduce it in any language.
Now go use it
See it work and build it yourself in Python, MQL5, Pine Script, EasyLanguage, or NinjaScript — then test a Heikin-Ashi rule in AlgoGen.
This post is educational, not financial advice. Indicators describe the past; they don’t predict the future. Backtest anything before you risk real money on it.