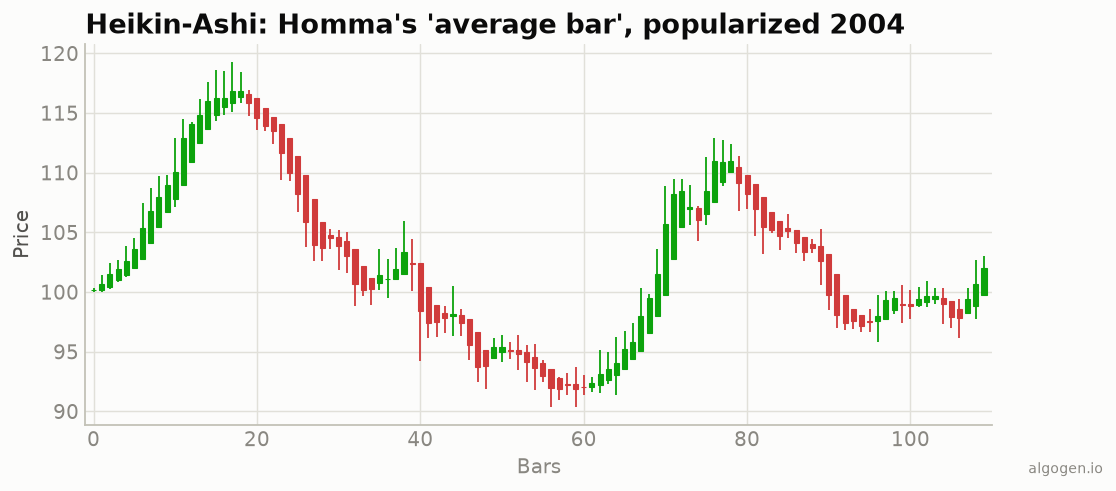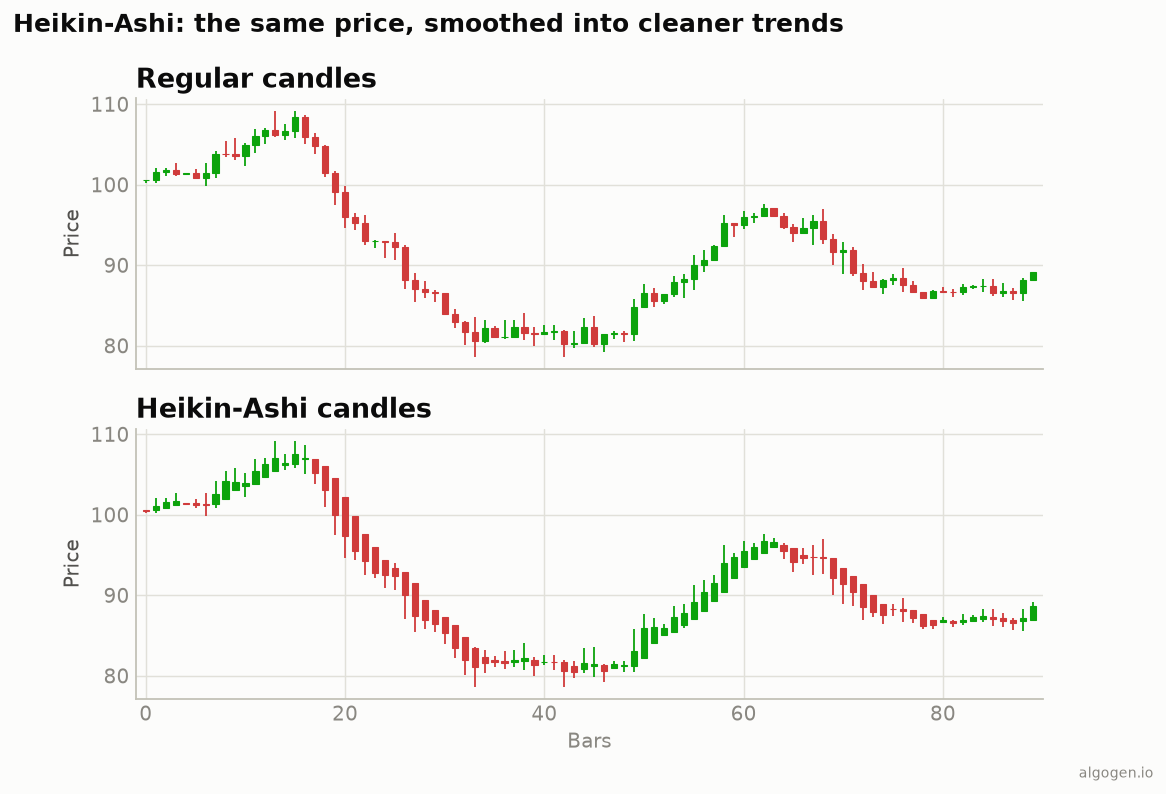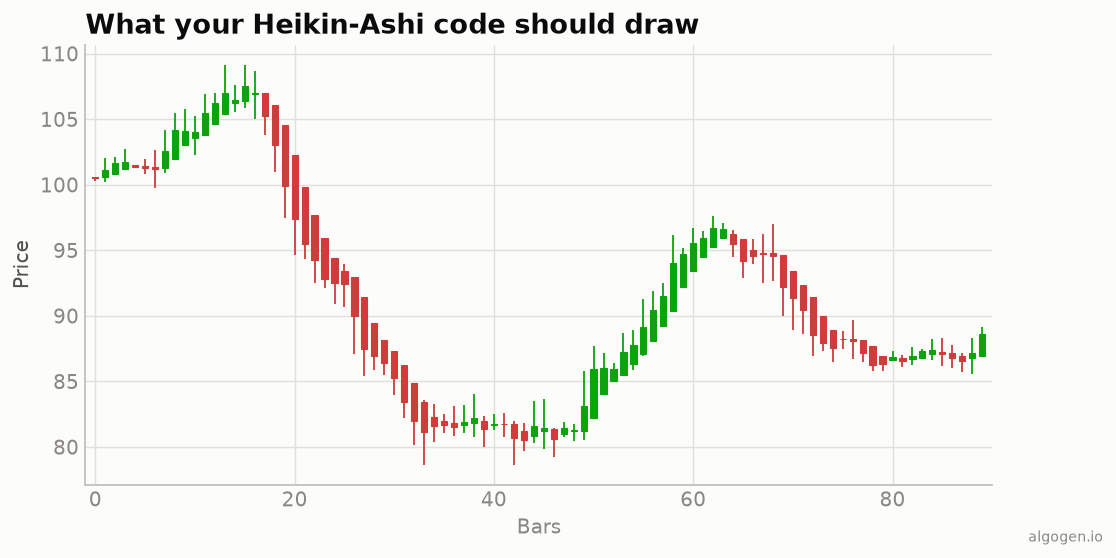
MetaTrader 5 draws Heikin-Ashi with the DRAW_COLOR_CANDLES plot type, which needs four
data buffers (open/high/low/close) plus a colour-index buffer. The math is the same
recursive averaging as everywhere else. See the explainer.
What you’ll need
- MetaTrader 5 and the MetaEditor
- A new Custom Indicator, plotted in the main chart window.
The source
#property indicator_chart_window
#property indicator_buffers 5
#property indicator_plots   1

#property indicator_label1  "Heikin-Ashi"
#property indicator_type1   DRAW_COLOR_CANDLES
#property indicator_color1  clrTomato, clrMediumSeaGreen
#property indicator_width1  1

double HaOpen[], HaHigh[], HaLow[], HaClose[], HaColor[];

int OnInit()
{
    SetIndexBuffer(0, HaOpen,  INDICATOR_DATA);
    SetIndexBuffer(1, HaHigh,  INDICATOR_DATA);
    SetIndexBuffer(2, HaLow,   INDICATOR_DATA);
    SetIndexBuffer(3, HaClose, INDICATOR_DATA);
    SetIndexBuffer(4, HaColor, INDICATOR_COLOR_INDEX);
    return(INIT_SUCCEEDED);
}

int OnCalculate(const int rates_total,
                const int prev_calculated,
                const datetime &time[],
                const double &open[],
                const double &high[],
                const double &low[],
                const double &close[],
                const long &tick_volume[],
                const long &volume[],
                const int &spread[])
{
    int start = (prev_calculated > 1) ? prev_calculated - 1 : 0;

    for(int i = start; i < rates_total; i++)
    {
        HaClose[i] = (open[i] + high[i] + low[i] + close[i]) / 4.0;

        if(i == 0)
            HaOpen[i] = (open[i] + close[i]) / 2.0;          // seed the first bar
        else
            HaOpen[i] = (HaOpen[i - 1] + HaClose[i - 1]) / 2.0;  // recursive

        HaHigh[i] = MathMax(high[i], MathMax(HaOpen[i], HaClose[i]));
        HaLow[i]  = MathMin(low[i],  MathMin(HaOpen[i], HaClose[i]));

        HaColor[i] = (HaClose[i] >= HaOpen[i]) ? 1 : 0;      // 1 = green, 0 = red
    }
    return(rates_total);
}
DRAW_COLOR_CANDLES reads the four OHLC buffers and picks a colour from HaColor (index
into the two indicator_color1 entries). The recursive HaOpen line is the heart of it.
Gotchas
HaOpenis recursive.HaOpen[i]readsHaOpen[i-1]andHaClose[i-1]; that’s the smoothing. Don’t compute it from rawopen[].- Seed bar 0.
(open[0] + close[0]) / 2. Without a seed, the whole series shifts. - Recompute from
prev_calculated - 1. Because each bar depends on the last, restart one bar back so the chain stays intact on updates. - Colour test is HA vs HA.
HaClose >= HaOpen, not real close vs real open.
Reading the real prices
Because Heikin-Ashi candles are averages, if you need the actual price for order
placement, read it from the standard close[]/open[] arrays, not from the HA buffers.
Plenty of MT5 traders run this indicator for the visual trend read and place orders off
the real price.
Same candles elsewhere: Python, Pine Script, EasyLanguage, NinjaScript. Then test it in AlgoGen.
This post is educational, not financial advice. Indicators describe the past; they don’t predict the future. Backtest anything before you risk real money on it.
Sources and further reading
- Technical indicator functions (MetaQuotes)