Pivot Points don’t have a famous inventor with a book and a formula named after them. They have something more evocative: an origin in the open-outcry trading pits, where floor traders needed levels they could compute in their heads before the bell and remember through the chaos of a shouting, hand-signaling trading day. That practical, low-tech birth explains everything about how pivots work.
Born on the floor
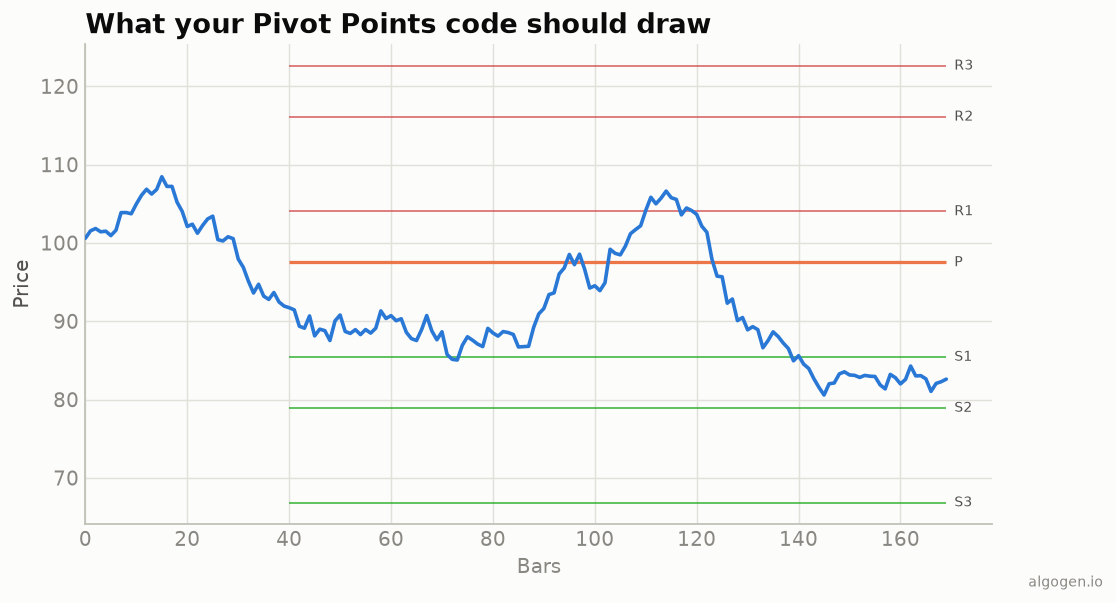
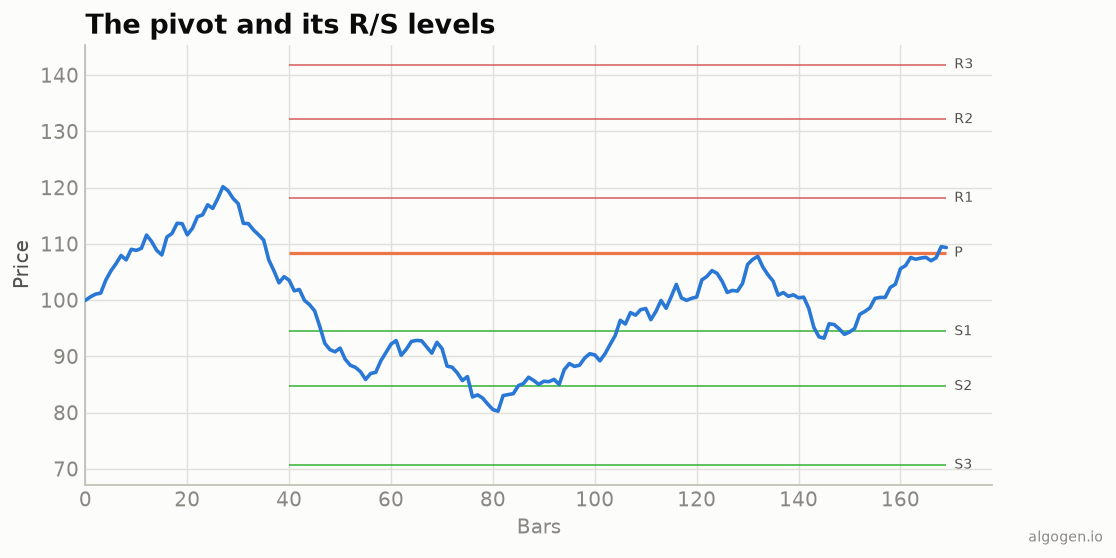
Before screens, traders stood in physical pits — for commodities, futures, options — buying and selling by voice and hand signal. In that environment you couldn’t run a smoothed oscillator; you needed numbers you could calculate quickly and keep in your head. Pivot Points fit perfectly: take yesterday’s high, low, and close, average them for the central pivot, and derive a handful of support and resistance levels with simple addition and subtraction. A floor trader could work them out each morning on a scrap of paper and trade off them all session.
Because of that grassroots, practical origin, standard pivots have no single named inventor — they were folk knowledge of the floor, passed around and refined by practitioners rather than published by one person. That’s a genuinely different pedigree from the Wilder-and-Lambert indicators elsewhere in this series, and it’s why you’ll see them called “floor pivots” or “classic pivots.”
Why the math is so simple
The simplicity isn’t a limitation — it’s the design goal. Every choice in the pivot formula favors mental arithmetic: the pivot is a plain three-number average; R1 and S1 are one doubling and one subtraction away; the wider levels just add the prior range. There’s no smoothing, no lookback, nothing that needs a computer. In an era when the “computer” was the trader’s own head, that was the whole point.
The named variants
Once pivots moved from the floor to the screen, analysts formalized and tweaked them into named families. Camarilla pivots (which appeared around the late 1980s) pack the levels tighter for range trading. Woodie’s pivots weight the close more heavily. Fibonacci pivots place the R/S levels at Fibonacci fractions of the prior range. DeMark pivots — from noted analyst Tom DeMark — change the base calculation depending on where the close sat relative to the open. All of them keep the core idea (project levels from the prior bar) and differ only in the arithmetic, which tells you how robust and adaptable the basic concept is.
Why they survived the move to screens
You might expect a mental-math tool to die once computers could run anything. Pivots did the opposite — they thrived — for two reasons. First, they’re self-fulfilling: so many traders learned the same floor pivots that the levels became real focal points for orders, and that clustering persisted onto the screen. Second, they have a quality few indicators share: the levels are known in advance and don’t move, which makes them uniquely convenient for planning a session’s trades. Software made them instant, but it was the traders’ collective attention that kept them relevant.
Today every charting platform offers pivots, usually with all the variants a click away. And, fittingly for a tool born of mental arithmetic, there’s nothing to buy: a three-number average and a few sums. You can compute the exact levels a 1970s pit trader used in a couple of lines, which is what we do in the implementation posts.
This post is educational, not financial advice. Indicators describe the past; they don’t predict the future. Backtest anything before you risk real money on it.