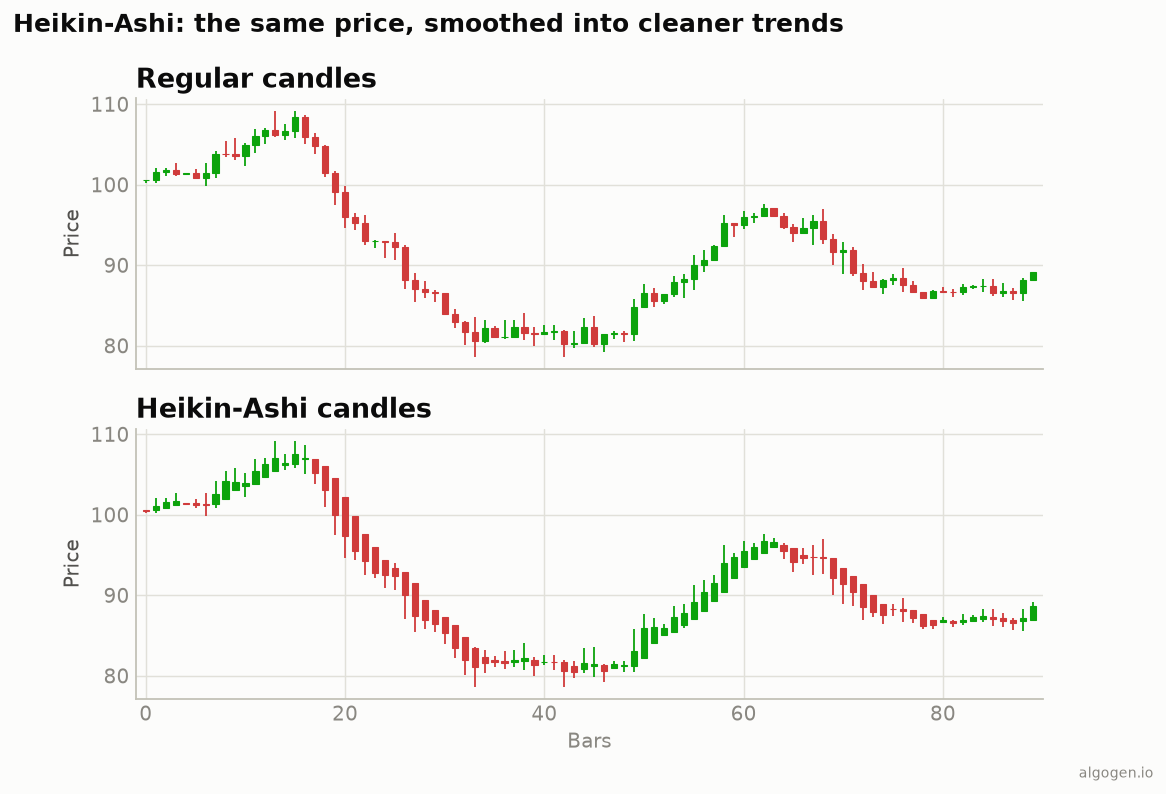
Heikin-Ashi isn’t an indicator you plot on a chart — it is the chart. It takes your ordinary candlesticks and reshapes them so trends look like clean, uninterrupted runs of colour and choppy noise gets averaged away. Look at the two panels above: same price, same period, but the Heikin-Ashi version below tells a much calmer story. Here’s exactly what it’s doing, and what you give up for that calm.
The one-sentence job
Heikin-Ashi replaces each candle’s raw open/high/low/close with averaged values, so consecutive bars share information and short-term noise cancels out. “Heikin-Ashi” is Japanese for “average bar” — which is precisely what each candle is.
The formula
Every Heikin-Ashi candle is built from the real OHLC plus the previous HA candle:
HA_Close = (Open + High + Low + Close) / 4        ← the average of this bar
HA_Open  = (previous HA_Open + previous HA_Close) / 2   ← carries the last bar forward
HA_High  = max(High, HA_Open, HA_Close)
HA_Low   = min(Low,  HA_Open, HA_Close)
The first candle has no “previous,” so HA_Open is seeded as (Open + Close) / 2.
The magic is in HA_Open: because it’s the midpoint of the prior HA candle, each new
bar is anchored to the last one. That chaining is what smooths the series — a single
wild bar can’t fully break the trend, because the next bar’s open is dragged back toward
where the last one closed.
How to read it
Colour = trend direction. A run of green (or hollow) HA candles is an uptrend; a run of red (or filled) is a downtrend. Because of the averaging, these runs are far longer and cleaner than with regular candles.
No lower wick in an uptrend, no upper wick in a downtrend signals a strong, uninterrupted move. When wicks start appearing on both ends and bodies shrink, momentum is fading — a common exit or caution cue.
Small bodies with wicks on both sides mark indecision or a potential turn, the Heikin-Ashi equivalent of a doji cluster.
What you’re trading away
This is the honest part most tutorials skip. Heikin-Ashi’s smoothness is not free:
- It lags. Because each bar is averaged and chained to the last, turns show up later than on real candles. You trade earliness for cleanliness.
- The prices are fake.
HA_Closeis an average, not a traded price. You cannot read the actual open or close of the bar off a Heikin-Ashi chart, which matters for exact entries, stops, and gap analysis. - It hides gaps. Overnight gaps get averaged into the body and effectively disappear — fine for trend reading, misleading if gaps are part of your edge.
- It can keep you in too long. The same smoothing that filters noise also delays the “get out” signal on a genuine reversal.
Heikin-Ashi vs regular candles
They answer different questions. Regular candles show you exactly what happened — every real open, close, and gap. Heikin-Ashi shows you the trend underneath, at the cost of precision and timeliness. Many traders run both: Heikin-Ashi to read direction at a glance, real candles for the actual entry and stop placement.
Where it lies to you
- The prices aren’t real. Never place a limit order at an HA open or close — it’s an average, not a level the market traded at.
- Lag on reversals. Smoother means slower; a sharp V-bottom will look muddy.
- Gap-blind. Don’t use it when overnight gaps are the thing you care about.
- Colour ≠ guaranteed follow-through. A single green candle isn’t a trend; the tool is designed to be read as runs.
Heikin-Ashi is one of the most useful reframings in charting precisely because it’s honest about one thing — it’s a trend view, not a price view. Use it for what it’s good at.
Now go test it, don’t trust it
Does entering on the first Heikin-Ashi colour flip (and exiting on the first opposite candle) actually beat buy-and-hold on your instrument? That’s a testable rule. Build it in AlgoGen. Then compute Heikin-Ashi yourself in Python, MQL5, Pine Script, EasyLanguage, or NinjaScript.
This post is educational, not financial advice. Indicators describe the past; they don’t predict the future. Backtest anything before you risk real money on it.