The Chande Momentum Oscillator has a clear, well-documented origin — a refreshing change from indicators whose histories dissolve into folklore. It comes from one book, one author, and one clear design philosophy, all from the mid-1990s.
The author
Tushar Chande is an engineer and trader with a PhD, and one of the more mathematically serious names in technical analysis. Where a lot of indicators came from floor traders working by intuition, Chande approached the field like the scientist he is — asking not just “what signal works” but “why do our standard tools behave badly, and can we design better ones?” He’s credited with several well-known indicators, including the CMO, the Aroon indicator (with Stanley Kroll), and the concept of adaptive moving averages.
The book (1994)
The CMO was introduced in “The New Technical Trader,” the 1994 book Chande co-authored with Stanley Kroll. The book’s whole thrust was modernizing the technical-analysis toolkit — taking familiar ideas and rebuilding them to be more responsive and more statistically honest. The Chande Momentum Oscillator was one of its headline tools.
The problem it was built to solve
Chande’s starting point was a critique of existing momentum oscillators, RSI in particular. RSI compares average gains to average losses, but it runs both through Wilder’s exponential smoothing — and Chande felt that smoothing muddied the raw momentum signal and made the indicator slow. He also disliked that RSI’s construction made it behave asymmetrically.
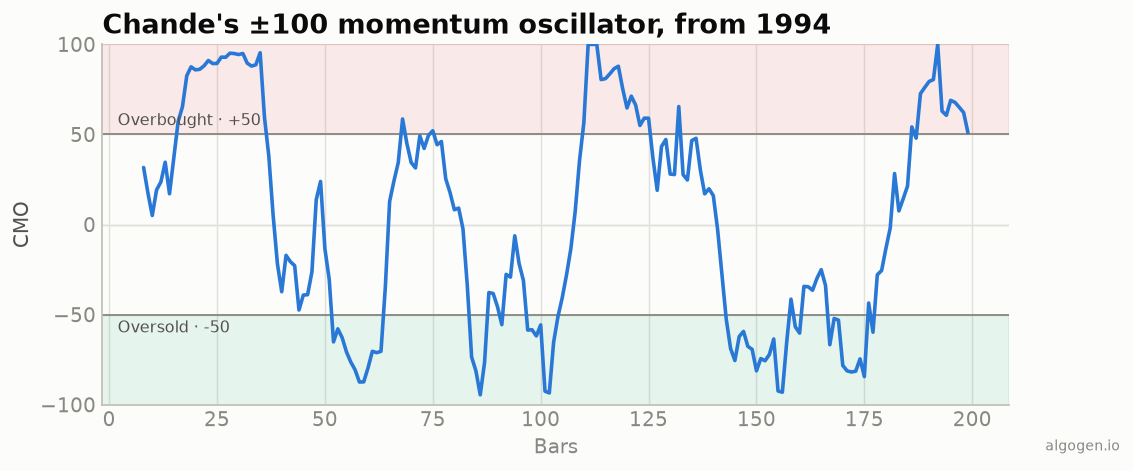
His fix was to go back to basics: sum the up-moves, sum the down-moves, and put their difference over their sum. No smoothing, a clean symmetric ±100 scale, and up and down movement both appearing directly in the formula. The CMO is, in essence, “RSI’s idea, done the way an engineer would do it” — stripped down to the raw momentum measurement without the smoothing layer.
The bigger idea: adaptive indicators
The CMO wasn’t just meant to be another line to eyeball. Chande’s larger project was adaptive technical analysis — indicators that change their own behaviour based on market conditions. The CMO was designed to feed that machinery.
His Variable Index Dynamic Average (VIDYA), for instance, is a moving average whose smoothing constant is scaled by the CMO: when momentum (the absolute value of the CMO) is high, the average tracks price more closely; when momentum is weak, it slows down and flattens out. That’s the CMO’s most sophisticated use — not as a standalone overbought/ oversold gauge, but as the “how strong is the move right now” input that lets other tools adapt. It’s a genuinely different way of thinking about indicators, and it’s the reason Chande built a momentum measure rather than reaching for an existing one.
Its place today
The CMO never became as ubiquitous as RSI — RSI’s head start and simplicity were hard to displace — but it earned a permanent spot in the toolkit. It ships as a built-in on essentially every modern platform (TradingView, MetaTrader, NinjaTrader, TradeStation), and it remains the go-to when a trader wants RSI’s logic with more responsiveness, or needs a clean momentum input for an adaptive system. Not bad for one chapter of a 30-year-old book.
Now go use it
See it work and build it yourself in Python, MQL5, Pine Script, EasyLanguage, or NinjaScript — then test a CMO rule in AlgoGen.
This post is educational, not financial advice. Indicators describe the past; they don’t predict the future. Backtest anything before you risk real money on it.