Most indicators in this series came from engineers, mathematicians, and floor traders. The Awesome Oscillator came from a psychologist. That background is the key to understanding not just the AO but the whole eccentric, ambitious system it belongs to — one that tried to marry chaos theory and trading psychology into a single method.
The psychologist who traded
The AO was created by Bill Williams (born 1932), a trader who came to markets with a background in psychology and a conviction that most traders lose because of their own minds, not because of bad indicators. He laid out his approach in two influential 1990s books — Trading Chaos (1995) and New Trading Dimensions (1998) — which argued that markets are nonlinear, chaotic systems and that a trader’s job is to read the market’s underlying structure while mastering their own psychology.
That’s a grander philosophical frame than “buy when the line crosses up,” and it shaped the tools. Williams built a whole interlocking set of indicators with characteristically vivid names: the Alligator (a set of shifted moving averages representing the market “sleeping” and “feeding”), Fractals, the Awesome Oscillator, and the Accelerator Oscillator. He described trading through these as moving through several “dimensions,” from identifying the trend to timing entries.
Where the AO fits
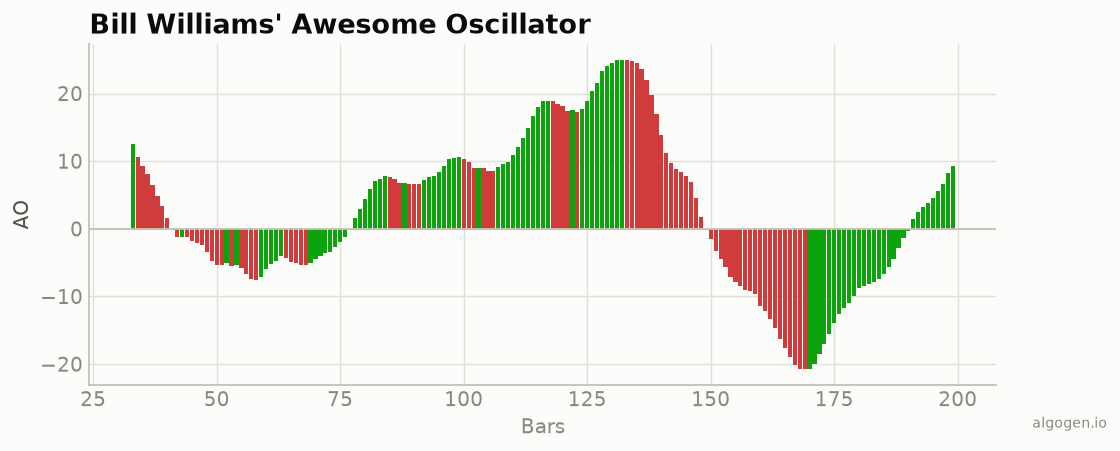
Within that system, the Awesome Oscillator is the momentum gauge — the piece
that answers “is the driving force behind price building or fading?” Williams
borrowed the basic mechanic from the MACD (a difference of two
moving averages) but made three telling changes: he used the median price
(H+L)/2 instead of the close, plain simple moving averages instead of
exponential ones, and the Fibonacci-flavored 5 and 34 periods. The median-price
choice reflects his belief that the bar’s midpoint captures the session’s real
center of gravity better than the somewhat arbitrary close.
The chaos-theory framing
It’s worth being clear-eyed here: the “chaos theory” branding was more inspiration than rigorous mathematics. Williams wasn’t running formal nonlinear-dynamics models; he was using the language of chaos and complexity to motivate a discretionary system and a psychology-first mindset. Whether one buys the framing or not, the individual tools are perfectly ordinary arithmetic — the AO especially so. That gap between the cosmic branding and the humble math is very much on-brand for this series.
Its companion: the Accelerator Oscillator
Williams paired the AO with a close relative, the Accelerator Oscillator (AC),
built directly on top of it: AC = AO − SMA(AO, 5). If the AO measures the market’s
momentum (“force”), the AC measures the change in that momentum (“acceleration”) —
Williams’ theory being that acceleration shifts before momentum does, and momentum
shifts before price. Whether or not that strict ordering holds, the AC is a neat
illustration of building one indicator on another: momentum, then the rate of
change of momentum. It ships alongside the AO on many platforms, and we include it
as a bonus in the implementation posts.
Why it endured
The Awesome Oscillator spread widely for a mix of reasons: Williams’ books had a devoted following, the name is impossible to forget, and — crucially — the formula is trivial to compute, so charting platforms added it readily. It also stands on its own reasonably well as a momentum histogram even for traders who never adopt the rest of the Williams system.
And, as ever, there’s nothing proprietary to buy: two simple moving averages of the bar midpoint, subtracted. You can build Bill Williams’ Awesome Oscillator in a couple of lines, which is exactly what we do in the implementation posts.
This post is educational, not financial advice. Indicators describe the past; they don’t predict the future. Backtest anything before you risk real money on it.